Hourly Satellite Data
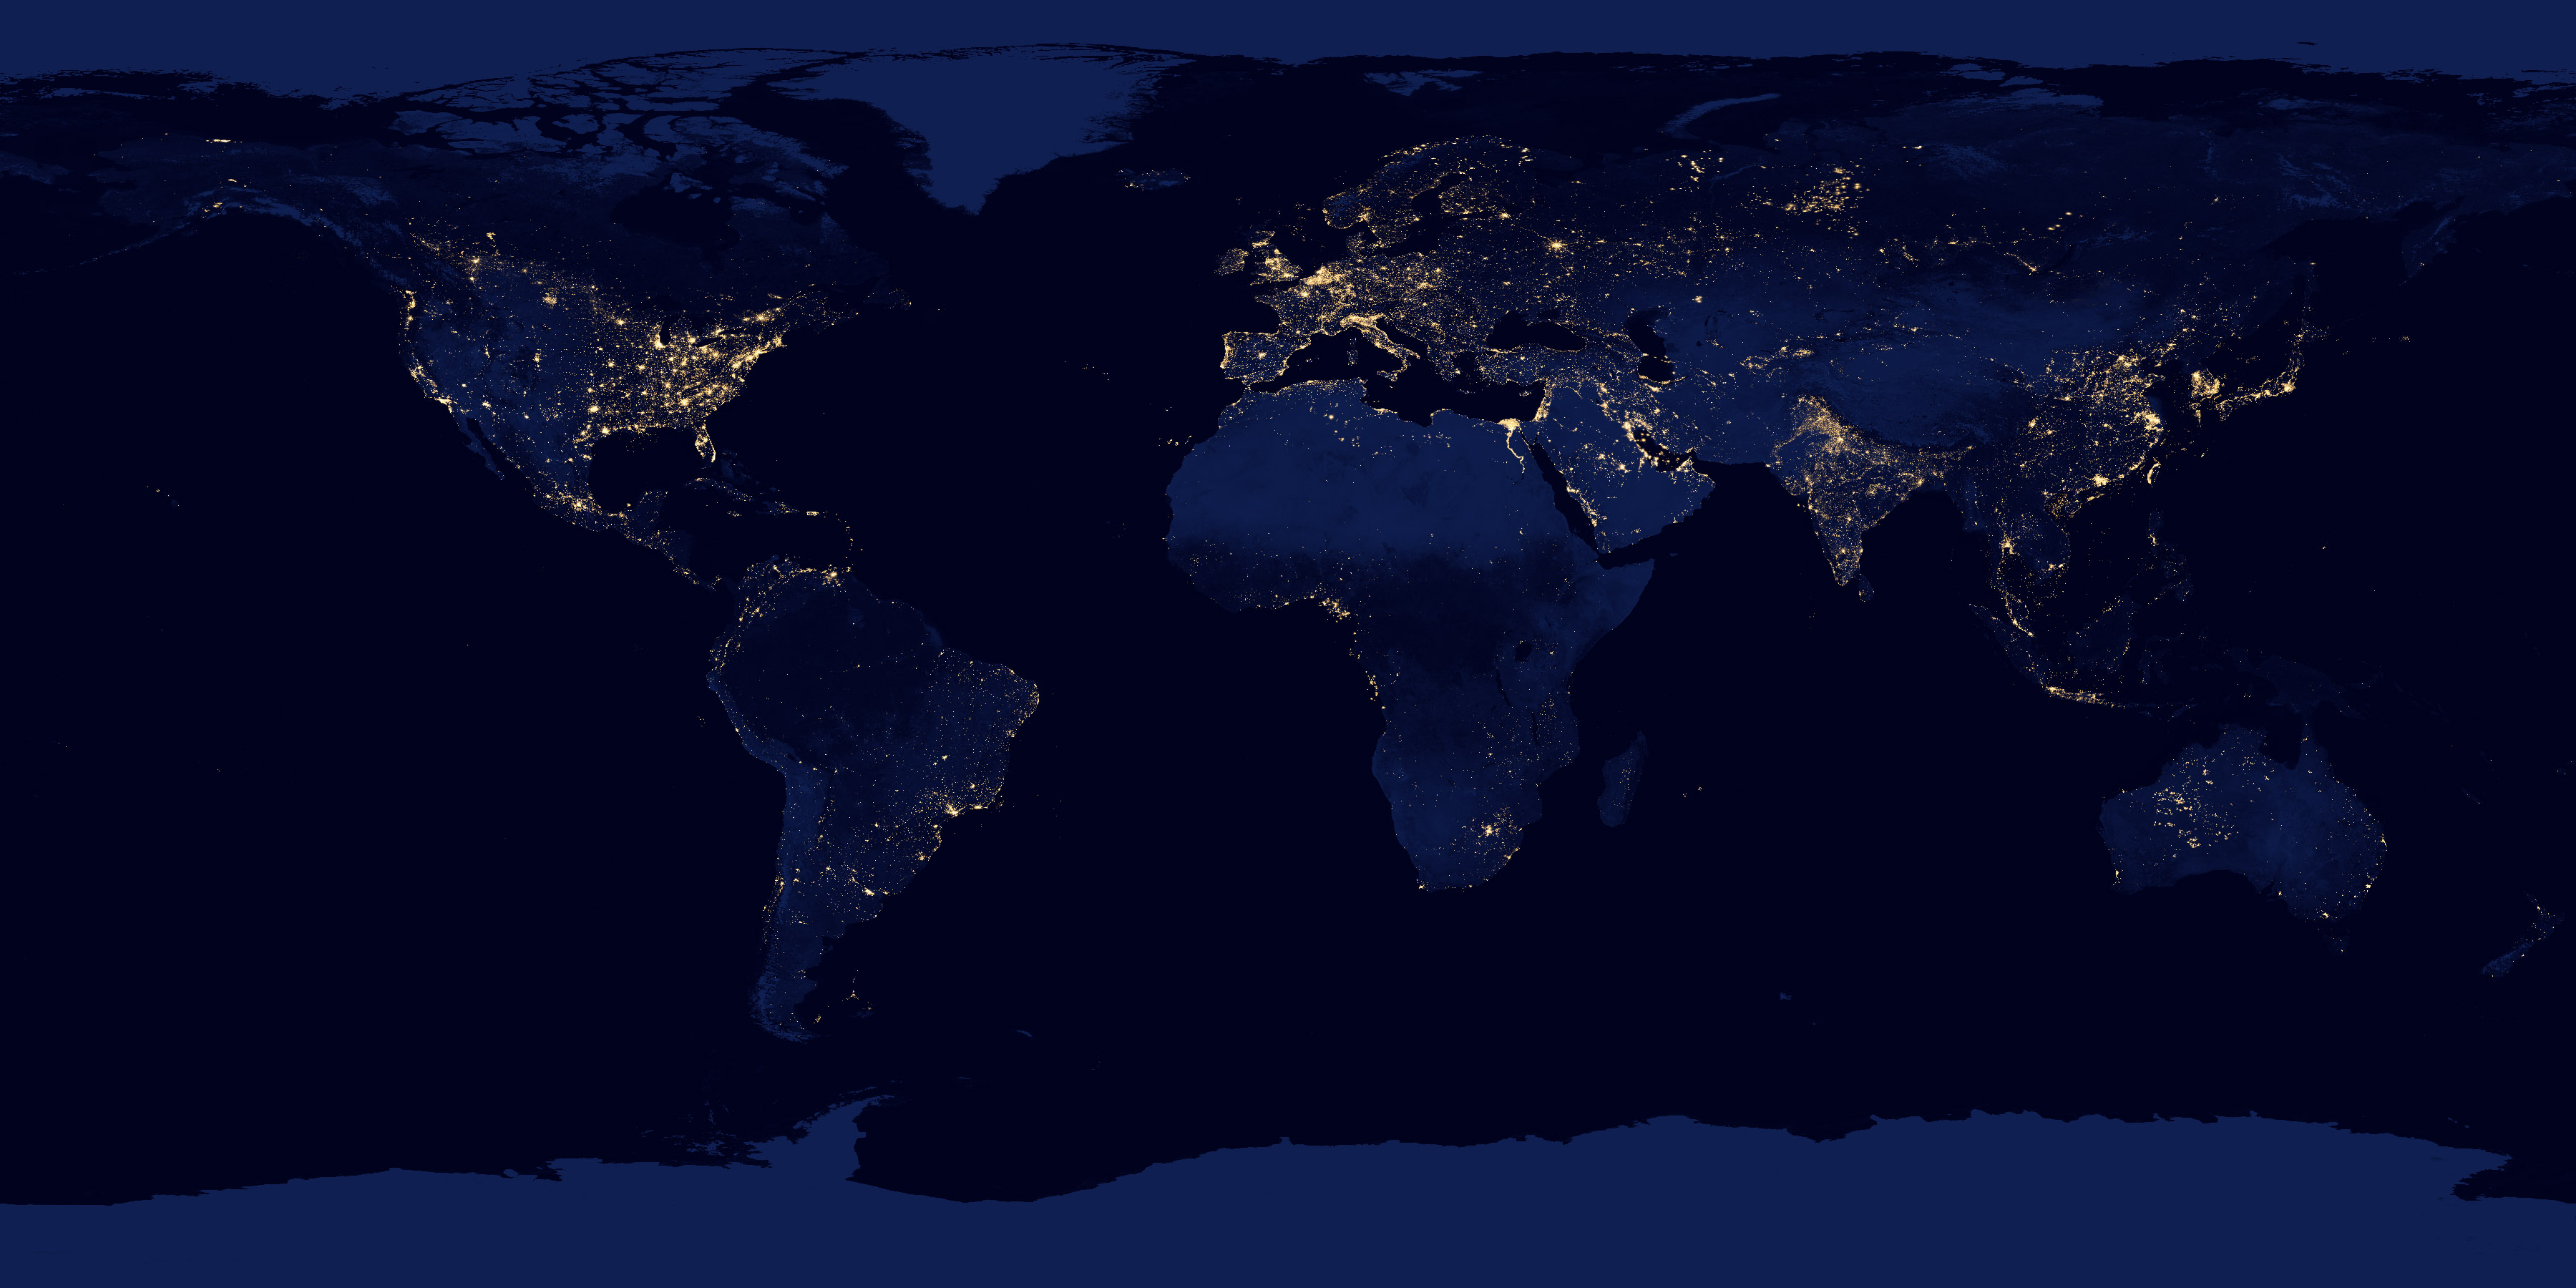
This page infers cloud cover using the ~0.6 micron and ~12.0 micron spectral bands extracted from the NOAA Global Mosaic of Geostationary Satellite Imagery (GMGSI), which combines data from five geostationary satellites (Himawari-9, GOES-16, GOES-18, Meteosat-9 and Meteosat-10), published at hourly intervals at 8 km spatial resolution. Hourly cloud cover data is combined with NASA Blue Marble Next Generation imagery including Topography, Bathymetry, and City Lights.
Data is downloaded from this S3 Bucket, processed with h5wasm and gpu.js. Sun and Moon positions are calculated with Astronomy Engine.
Notes
- I started doubting some of the data sources when I noticed city lights in Western Australia. This is a well-known quirk of the 2017 Black Marble Imagery: These are actually fires, as detailed in this article.
- The current processing struggles with correcting for latitude (far from the equator, the Earth looks “foggy”) and does not infer smoke very well. NOAA’s Earth in Real-Time provides more easily consumed viewer of near-realtime geostationary satellite imagery that does better in this regard.